| FULL MARKET SUMMARY |
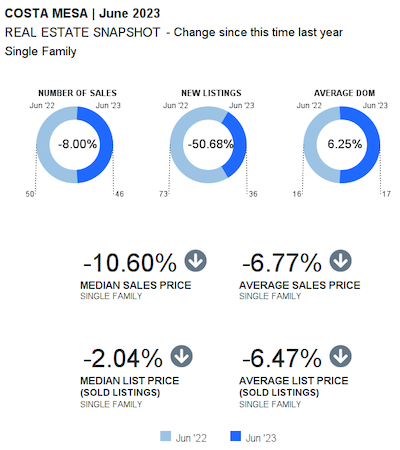
| June 2023 | Single Family |
 |
|
|
Month to Date |
Year to Date |
|
June 2023 |
June 2022 |
% Change |
YTD 2023 |
YTD 2022 |
% Change |
| New Listings |
36 |
73 |
-50.68% |
242 |
362 |
-33.15% |
| Sold Listings |
46 |
50 |
-8% |
195 |
258 |
-24.42% |
| Median List Price (Solds) |
$1,322,500 |
$1,350,000 |
-2.04% |
$1,299,500 |
$1,299,900 |
-0.03% |
| Median Sold Price |
$1,309,750 |
$1,465,000 |
-10.6% |
$1,285,000 |
$1,387,000 |
-7.35% |
| Median Days on Market |
8 |
11 |
-27.27% |
14 |
8 |
75% |
| Average List Price (Solds) |
$1,435,771 |
$1,535,162 |
-6.47% |
$1,427,443 |
$1,414,441 |
0.92% |
| Average Sold Price |
$1,466,423 |
$1,572,924 |
-6.77% |
$1,430,846 |
$1,487,464 |
-3.81% |
| Average Days on Market |
17 |
16 |
6.25% |
29 |
16 |
81.25% |
| List/Sold Price Ratio |
102.2% |
103% |
-0.76% |
100.6% |
105.9% |
-4.99% |
|
| SOLD AND NEW PROPERTIES (UNITS) |
| June 2023 | Single Family |
|
|
Sold Properties | Number of properties sold during the year
New Properties | Number of properties listed during the year. |
|
|