Here is your latest Newport Beach single family homes for Activity Report for August 2023, analyzing data as it affects a specific market area. The Market Summary below offers a look at sales activity for the prior month and year, along with current and past year-to-date statistics. The graphs cover several different aspects of the real estate market. Note how some of the graphs break out trends by price increments.
Please contact us if you would like more information on the current market.
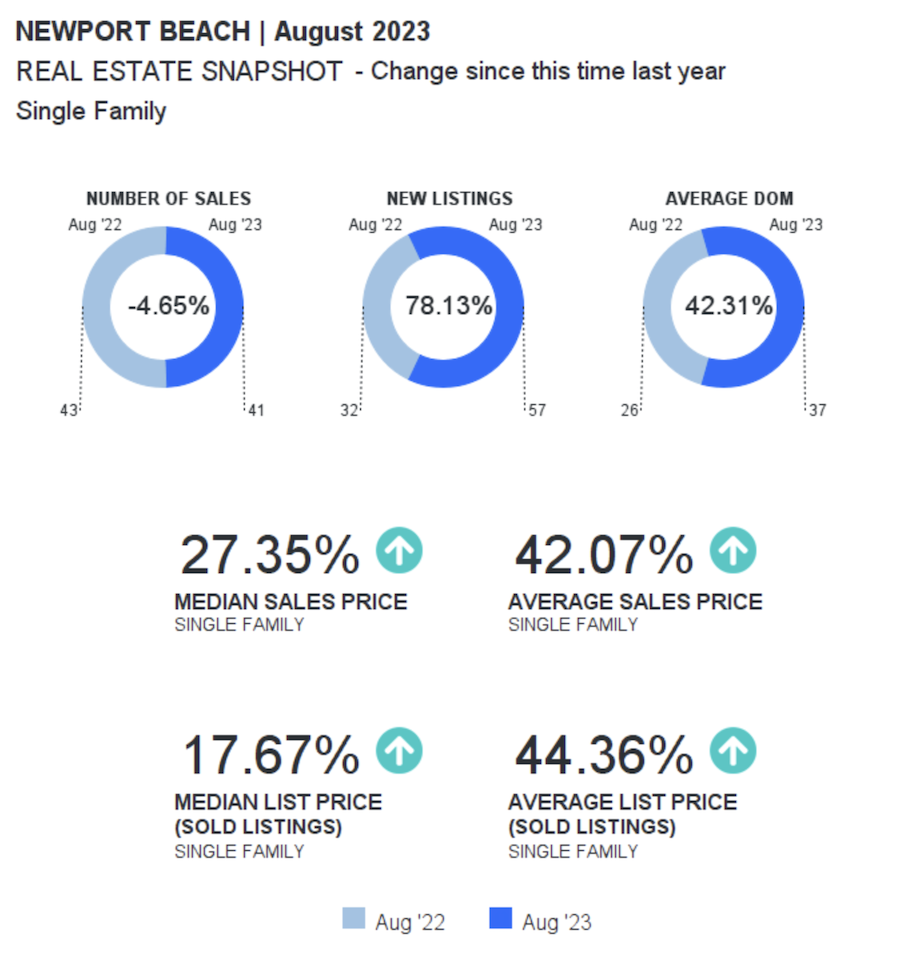
Orange County | Newport Beach | Single Family Homes | Area Report | August 2023
 |
Area
Report |
| NEWPORT BEACH |
| AUGUST 2023 | SINGLE FAMILY |
|
|
Dear Devin,
Here is your latest Area Report, analyzing data as it affects a specific market area. The Market Summary below offers a look at sales activity for the prior month and year, along with current and past year-to-date statistics. The graphs cover several different aspects of the real estate market. Note how some of the graphs break out trends by price increments. Please contact us if you would like more information on the current market.
|
|
|
|
|
|
|
Area
Report |
| NEWPORT BEACH |
|
|
| FULL MARKET SUMMARY |
| August 2023 | Single Family |
|
|
|
Month to Date |
Year to Date |
|
August 2023 |
August 2022 |
% Change |
YTD 2023 |
YTD 2022 |
% Change |
| New Listings |
54 |
32 |
68.75% |
422 |
519 |
-18.69% |
| Sold Listings |
41 |
43 |
-4.65% |
257 |
361 |
-28.81% |
| Median List Price (Solds) |
$3,995,000 |
$3,395,000 |
17.67% |
$3,595,000 |
$3,500,000 |
2.71% |
| Median Sold Price |
$4,200,000 |
$3,298,000 |
27.35% |
$3,500,000 |
$3,500,000 |
0% |
| Median Days on Market |
19 |
20 |
-5% |
19 |
15 |
26.67% |
| Average List Price (Solds) |
$6,246,390 |
$4,326,953 |
44.36% |
$4,729,034 |
$4,367,666 |
8.27% |
| Average Sold Price |
$5,989,585 |
$4,215,871 |
42.07% |
$4,547,497 |
$4,322,627 |
5.2% |
| Average Days on Market |
37 |
26 |
42.31% |
41 |
31 |
32.26% |
| List/Sold Price Ratio |
98.5% |
97.9% |
0.59% |
97.3% |
99.9% |
-2.68% |
|
| SOLD AND NEW PROPERTIES (UNITS) |
| August 2023 | Single Family |
|
|
Sold Properties | Number of properties sold during the year
New Properties | Number of properties listed during the year. |
|
|
| MEDIAN SALES PRICE AND NUMBER OF SALES |
| August 2023 | Single Family |
|
|
Median Sales Price | Price of the “”middle”” property sold -an equal number of sales were above and below this price.
Number of Sales | Number of properties sold. |
|
| AVERAGE SALES PRICE AND AVERAGE DAYS ON MARKET |
| August 2023 | Single Family |
|
|
Average Sales Price | Average sales price for all properties sold.
Average Days on Market | Average days on market for all properties sold. |
|
|
| SALES PRICE AS A PERCENTAGE OF ORIGINAL PRICE |
| August 2023 | Single Family |
|
|
| Sale Price as a Percentage of Original Price | Average sale price of property as percentage of final list price. |
|
| AVERAGE SALES PRICE AND NUMBER OF PROPERTIES FOR SALE |
| August 2023 | Single Family |
|
|
Average Sales Price | Average sales price for all properties sold.
Properties for Sale | Number of properties listed for sale at the end of month. |
|
|
| PROPERTIES FOR SALE AND SOLD PROPERTIES |
| August 2023 | Single Family |
|
|
Properties for Sale | Number of properties listed for sale at the end of month.
Sold Properties | Number of properties sold. |
|
| AVERAGE ASKING/SOLD/UNSOLD PRICE |
| August 2023 | Single Family |
|
|
Asking Price | the average asking price of sold properties
Sold Price | the average selling price
Unsold Price | the average active list price |
|
|
| ABSORPTION RATE |
| August 2023 | Single Family |
|
|
| Absorption Rate | Looks at the past year’s monthly supply of inventory. In a normal market there should be a 6 month supply. The higher the rate above 6 the more aggressive a seller has to be with the competition; price and having a picture perfect property. |
|
| MONTHS SUPPLY OF INVENTORY |
| August 2023 | Single Family |
|
|
Months Supply of Inventory | Properties for sale divided by number of properties sold.
Units Listed | Number of properties listed for sale at the end of month.
Units Sold | Number of properties sold. |
|
|
|
|
|
The property information herein is derived from various sources that may include, but not be limited to, county records and the Multiple Listing Service, and it may include approximations.
Although the information is believed to be accurate, it is not warranted and you should not rely upon it without personal verification. ©2023 Coldwell Banker. All Rights Reserved. Coldwell Banker and the Coldwell Banker logos are trademarks of Coldwell Banker Real Estate LLC. The Coldwell Banker® System is comprised of company owned offices which are owned by a subsidiary of Anywhere Advisors LLC and franchised offices which are independently owned and operated.
The Coldwell Banker System fully supports the principles of the Fair Housing Act and the Equal Opportunity Act. |
|
Lucas Real Estate
2901 West Coast Highway Suite 200 | Newport Beach | California | 92663-4023
info@lucas-real-estate.com | 949.478.1623 office
Devin Lucas BRE No. 01912302 | Courtney Lucas BRE No. 02015514
Lucas Real Estate, a dynamic full-service residential real estate team led by Devin Lucas, REALTOR®, Real Estate Broker, and Real Estate Attorney, and Courtney Lucas, REALTOR® and CPA, offers unparalleled expertise in Newport Beach and surrounding areas.
Privacy Policy | Accessibility | Disclaimer | Newsletter | Social Media
|