Area
Report |
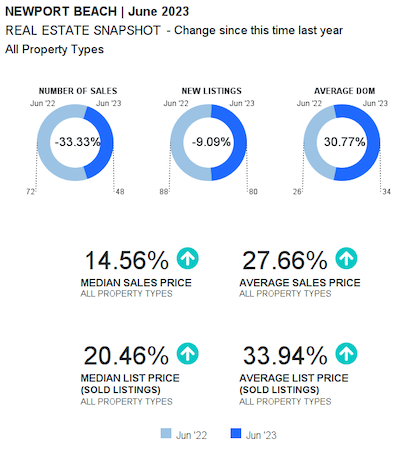
| NEWPORT BEACH |
|
|
| FULL MARKET SUMMARY |
| June 2023 | All Property Types |
 |
|
|
Month to Date |
Year to Date |
|
June 2023 |
June 2022 |
% Change |
YTD 2023 |
YTD 2022 |
% Change |
| New Listings |
80 |
88 |
-9.09% |
428 |
616 |
-30.52% |
| Sold Listings |
48 |
72 |
-33.33% |
277 |
420 |
-34.05% |
| Median List Price (Solds) |
$3,400,000 |
$2,822,500 |
20.46% |
$2,875,000 |
$2,824,500 |
1.79% |
| Median Sold Price |
$3,225,000 |
$2,815,000 |
14.56% |
$2,800,000 |
$2,850,000 |
-1.75% |
| Median Days on Market |
20 |
17 |
17.65% |
23 |
11 |
109.09% |
| Average List Price (Solds) |
$4,432,060 |
$3,309,048 |
33.94% |
$3,537,475 |
$3,501,369 |
1.03% |
| Average Sold Price |
$4,247,737 |
$3,327,473 |
27.66% |
$3,398,397 |
$3,491,011 |
-2.65% |
| Average Days on Market |
34 |
26 |
30.77% |
44 |
28 |
57.14% |
| List/Sold Price Ratio |
96.9% |
101% |
-4.15% |
97.1% |
100.9% |
-3.73% |
|
| SOLD AND NEW PROPERTIES (UNITS) |
| June 2023 | All Property Types |
|
|
Sold Properties | Number of properties sold during the year
New Properties | Number of properties listed during the year. |
|
|